👁 Live Traffic Monitor
Watch every HTTP request hitting your WordPress site in real time. Filter by bots, humans, and blocked visitors. Analyze user agents, response codes, and request patterns to understand exactly who is accessing your site and why.
See It in Action
Explore the admin interface — click any screenshot to zoom
What This Solves
Most WordPress site owners have no idea what is happening on their site right now. Bots, scrapers, and brute-force tools generate thousands of requests per day — and they are invisible without traffic monitoring. The Live Traffic Monitor gives you a real-time view of every HTTP request, classified by type, so you can distinguish legitimate visitors from automated threats and take action before damage is done.
Who This Module Is For
Site Owners Who Want Visibility
You know something is slowing your site down or generating errors, but you cannot see what. Live Traffic shows every request with its response code, user agent, and origin — so you can diagnose problems in minutes instead of guessing.
Security-Conscious Administrators
Brute-force attacks, vulnerability scanners, and content scrapers leave fingerprints in your traffic. Monitoring requests in real time lets you identify and block attackers before they find a way in.
Developers Debugging Issues
API calls returning errors? A plugin making unexpected requests? Live Traffic gives you a server-side view of every request — no browser dev tools required. Filter by endpoint, status code, or IP to isolate problems fast.
Key Features
Real-Time Request Feed
Watch HTTP requests as they arrive. Each entry shows the request URI, HTTP method, response code, IP address, user agent, and timestamp — updated in real time without page refresh.
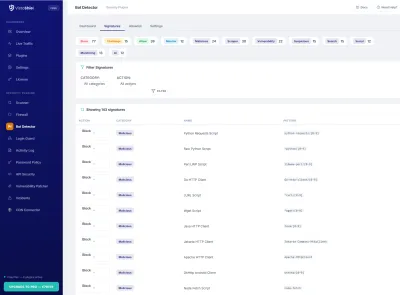
Bot vs Human Classification
Every request is classified as human visitor, known bot, suspicious bot, or blocked. Filter the traffic feed by type to focus on what matters — legitimate traffic or automated threats.
User Agent Analysis
Break down traffic by user agent string. Identify the most active bots, browsers, and crawlers hitting your site. Spot fake user agents and disguised scrapers before they waste your resources.
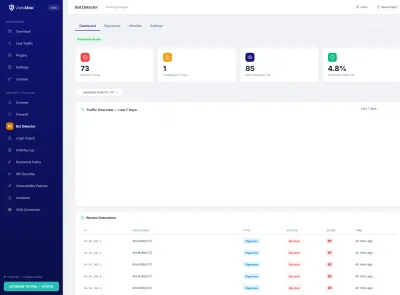
Response Code Dashboard
Visual breakdown of HTTP response codes: 200s, 301s, 404s, 403s, and 500s. Spike in 404s? Likely a vulnerability scanner. Spike in 403s? Your firewall is blocking something. See it at a glance.
Geographic Origin Data
See where requests originate by country. Identify suspicious traffic patterns from regions you do not serve. Useful context for deciding whether to implement country-level blocking rules.
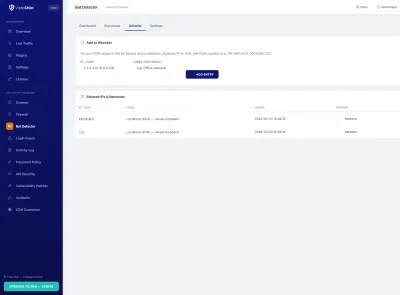
Advanced Filtering
Filter the traffic log by IP address, URI pattern, HTTP method, response code, user agent, or visitor type. Combine multiple filters to isolate specific traffic patterns for investigation.
Why Upgrade to Pro
Free gives you real-time traffic visibility for the current session. Pro adds long-term traffic history — see traffic patterns over weeks and months, not just the last 48 hours. Track how bot activity changes over time, export traffic data for analysis, and receive automated reports. Your cloud dashboard aggregates traffic from all your sites in one view.
Free vs Pro
Monitor traffic for free. Pro adds long-term history, cross-site aggregation, and automated reporting for professional security operations.
| Feature | Free | Pro |
|---|---|---|
| Real-time request feed | ✓ | ✓ |
| Bot vs human classification | ✓ | ✓ |
| User agent analysis | ✓ | ✓ |
| Traffic history | 48 hours | Up to 10 years |
| Geographic origin data | ✓ | ✓ |
| Cloud dashboard aggregation | ✗ | ✓ |
| PDF traffic reports | ✗ | ✓ Weekly |
| Priority support | Community | 24h email |
| €0 forever | €79 /year (10 sites) — €6.50/mo | |
| Included Free | Start Free Trial No credit card required |
All Pro features included in the Pro plan at €79/year (10 sites). Managing client sites? See Agency plan →
See What Is Happening on Your Site Right Now
Install VistoShield and enable Live Traffic Monitor to get real-time visibility into every request hitting your WordPress site.
Get Started Free See All Plans →